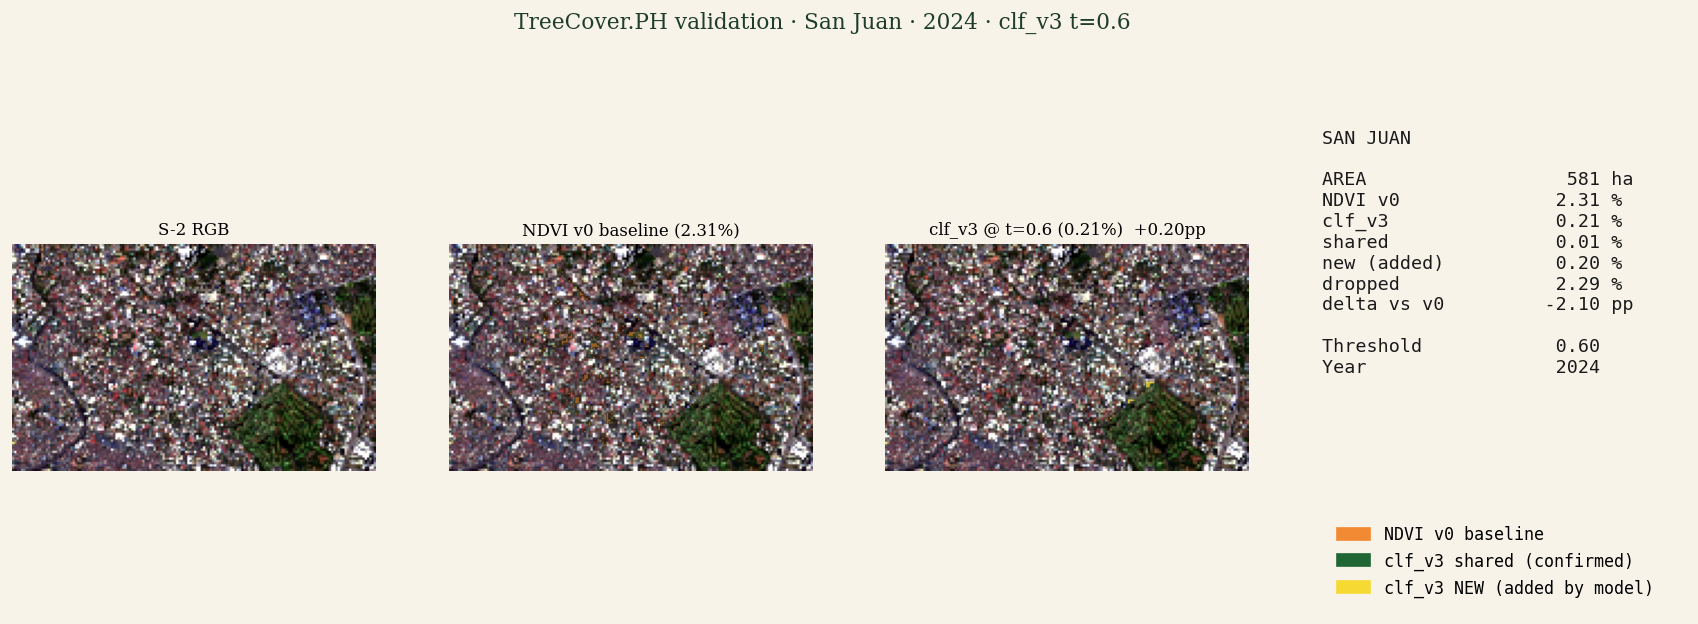
SECTION 5 · VALIDATION GALLERY · DETECTION MODEL · t=0·60
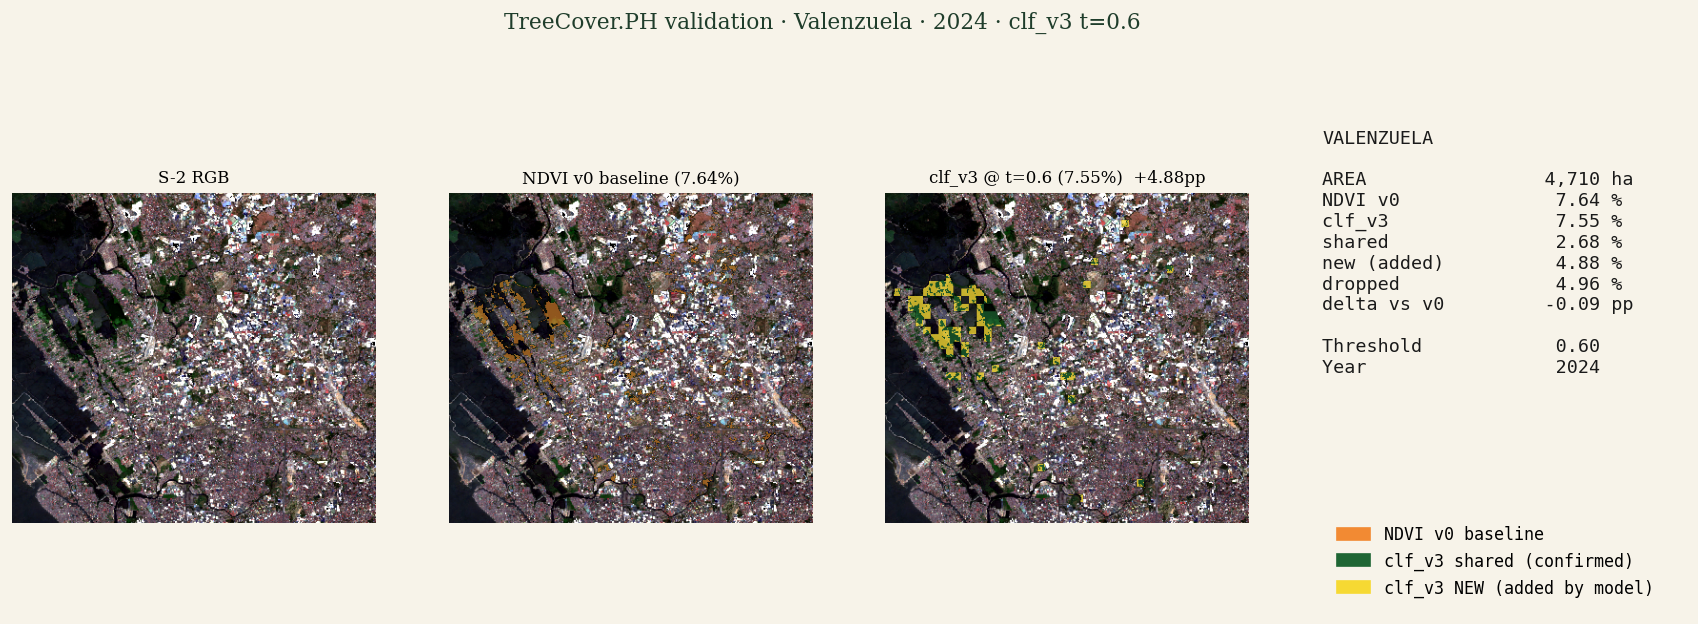
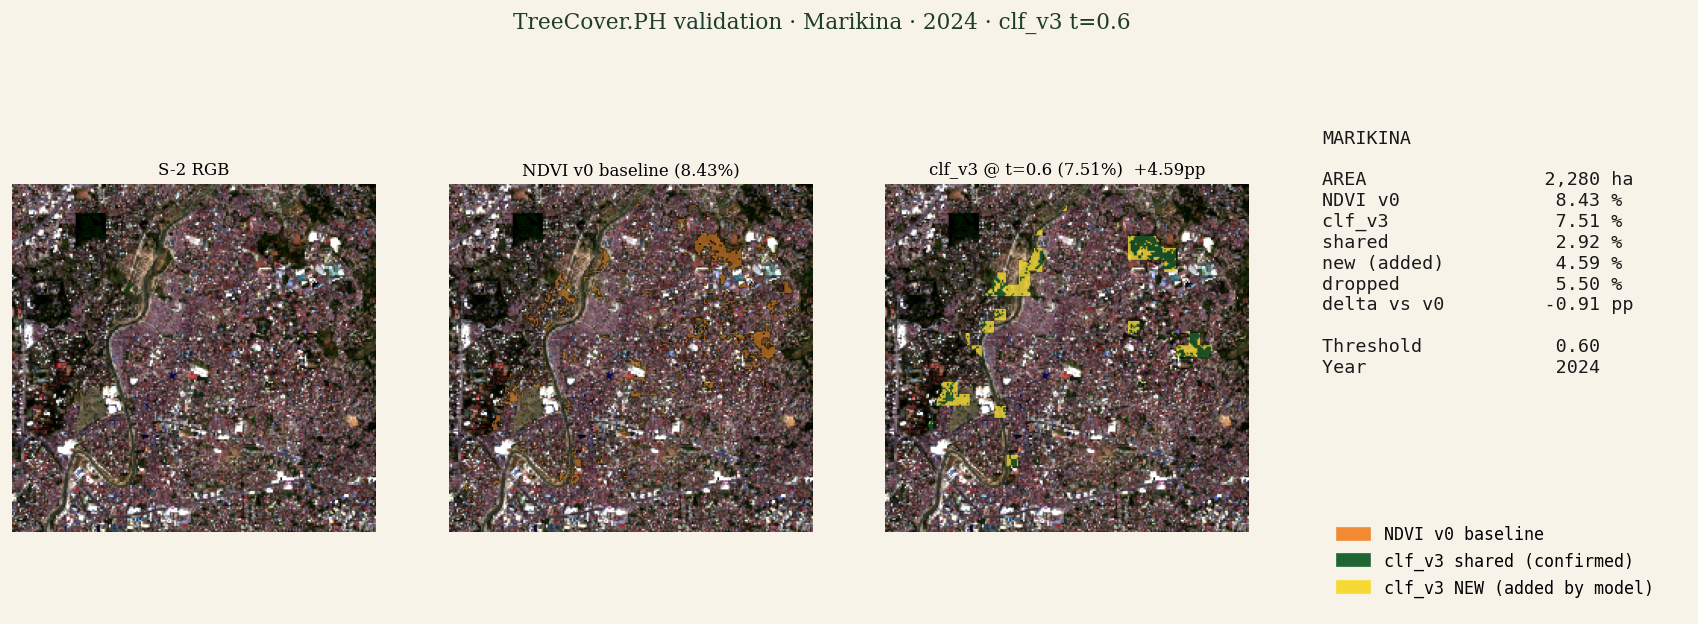
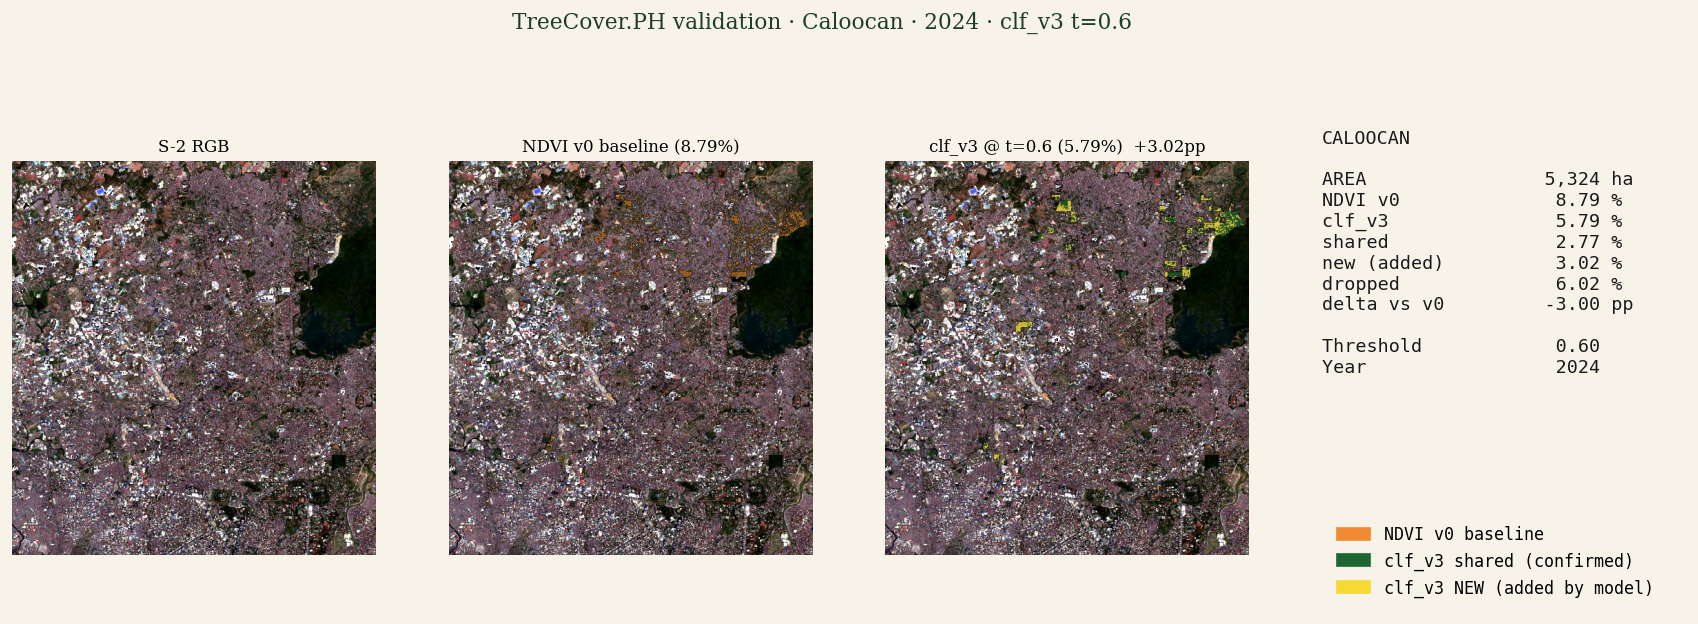
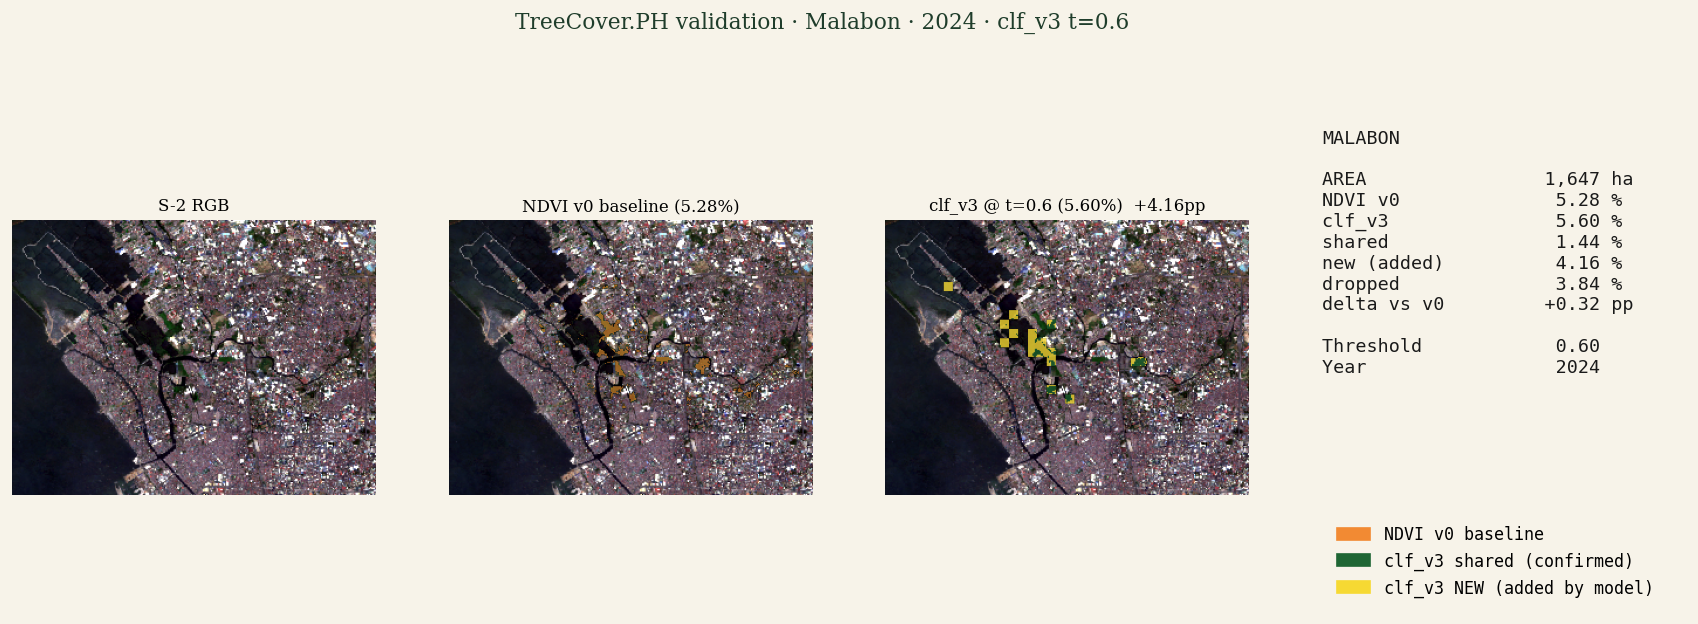
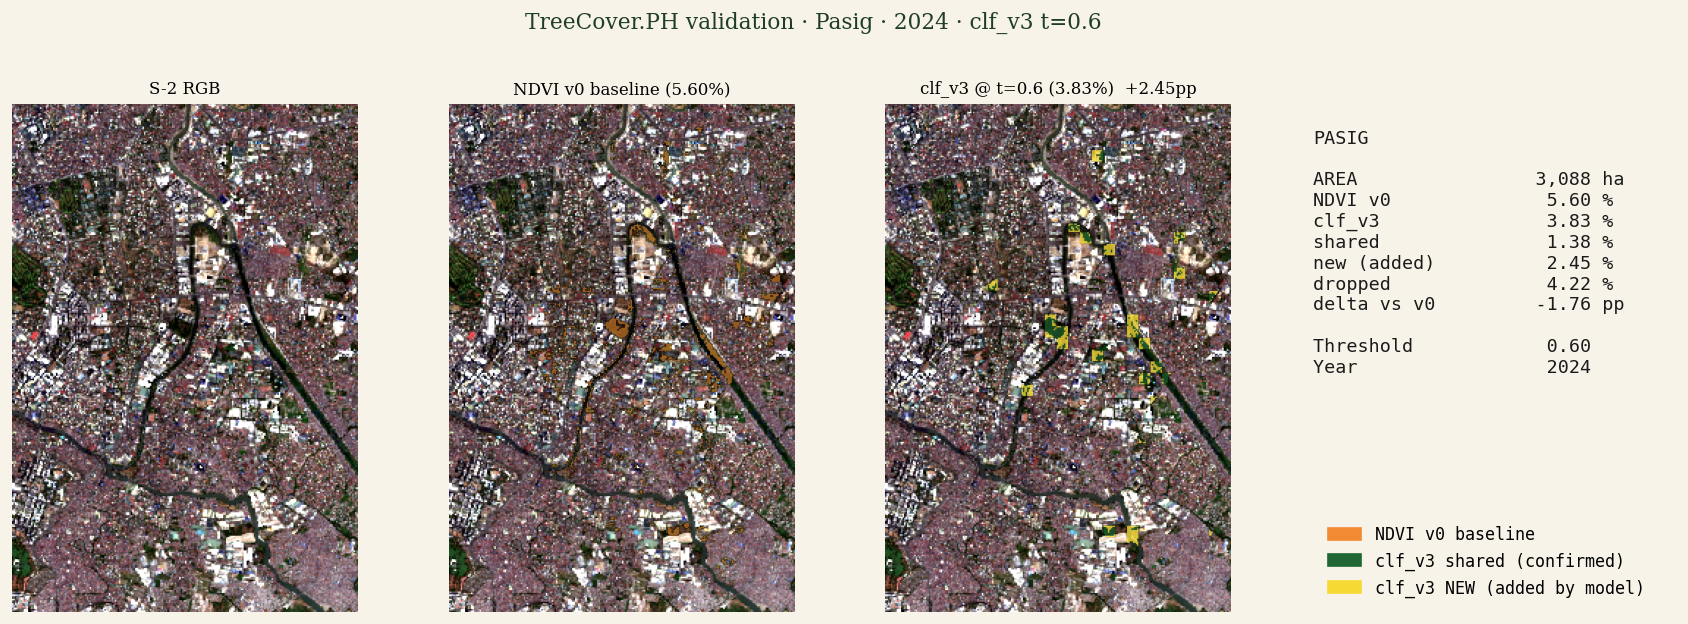
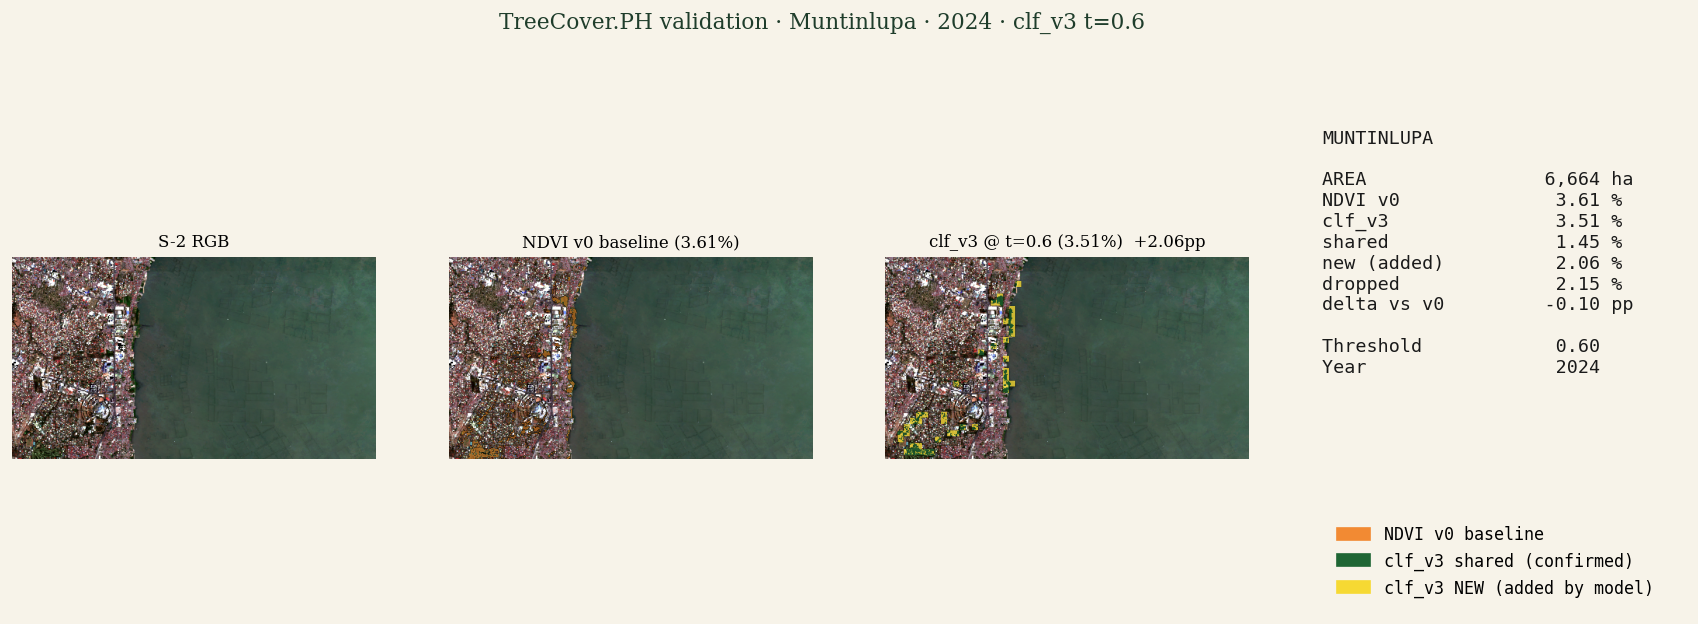
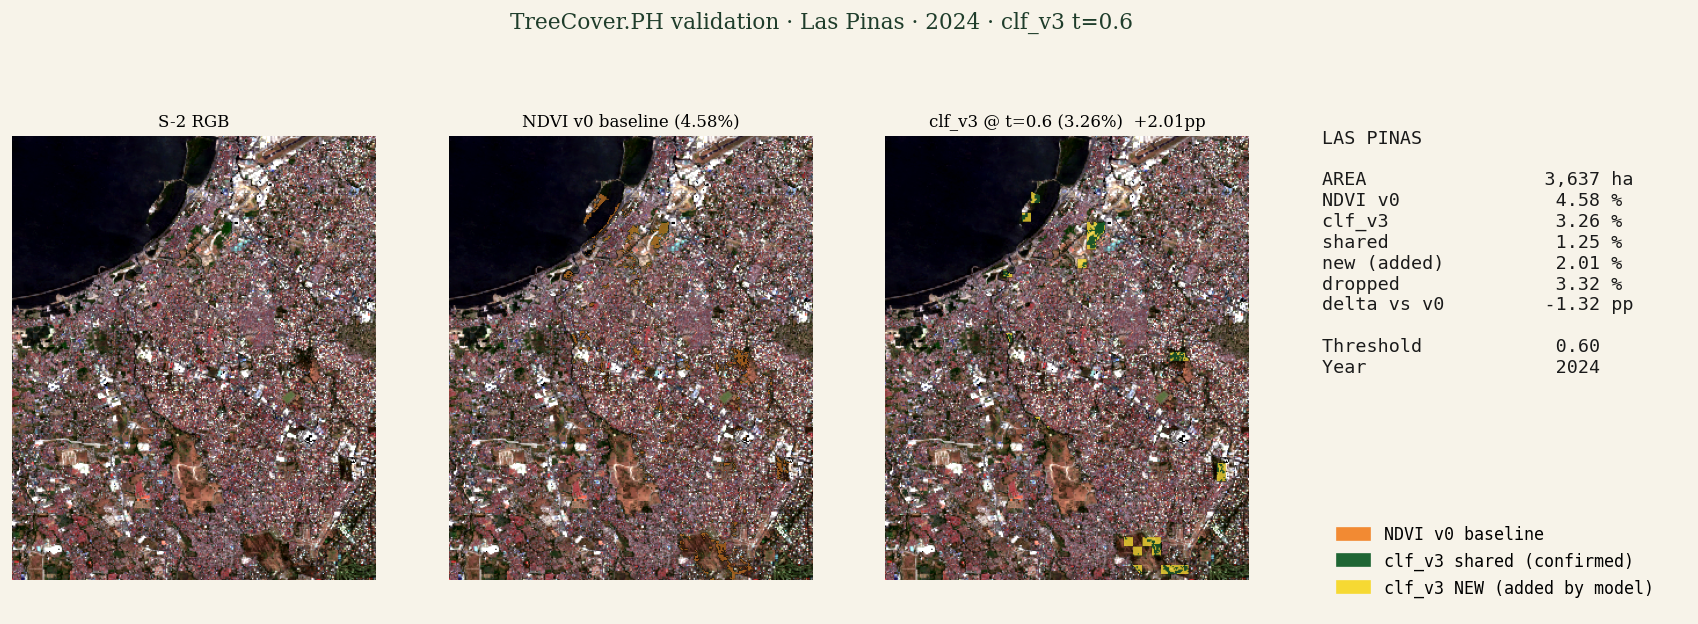
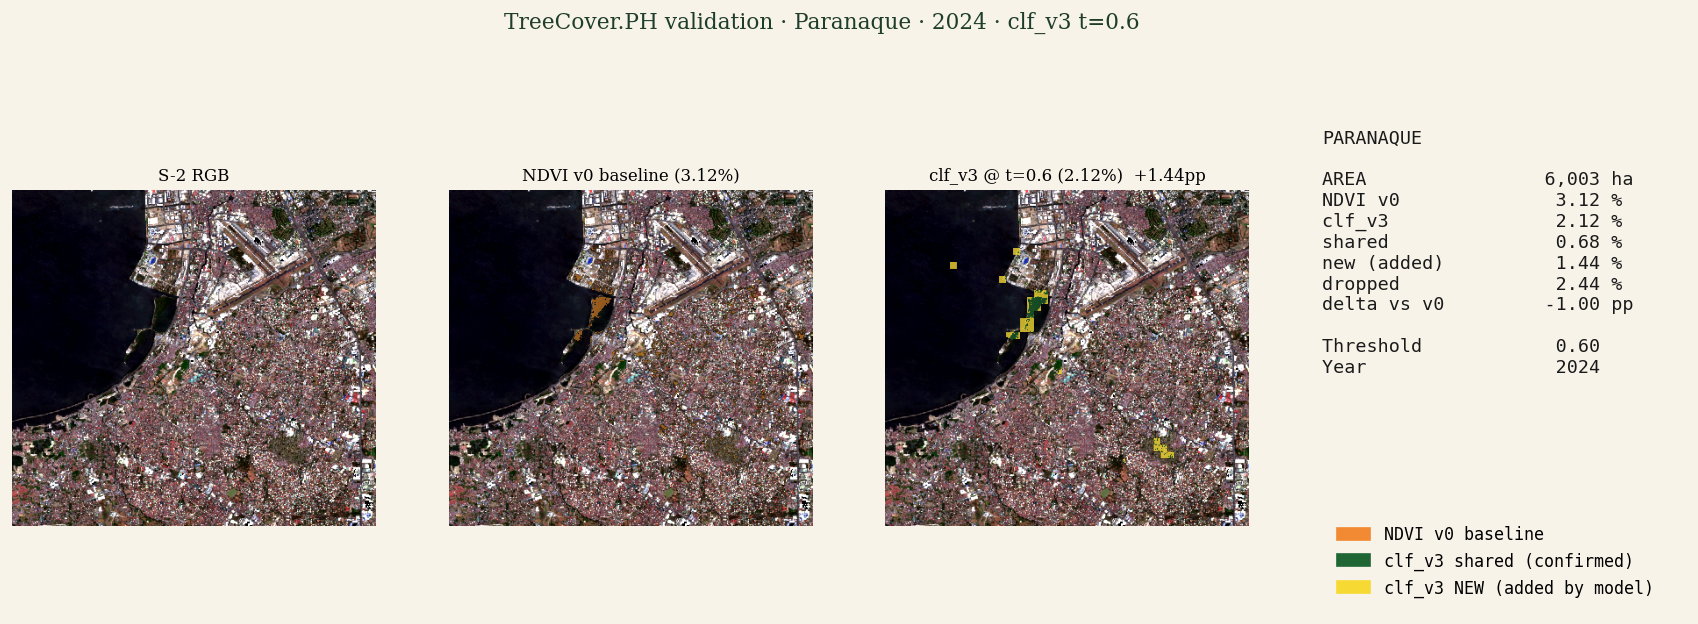
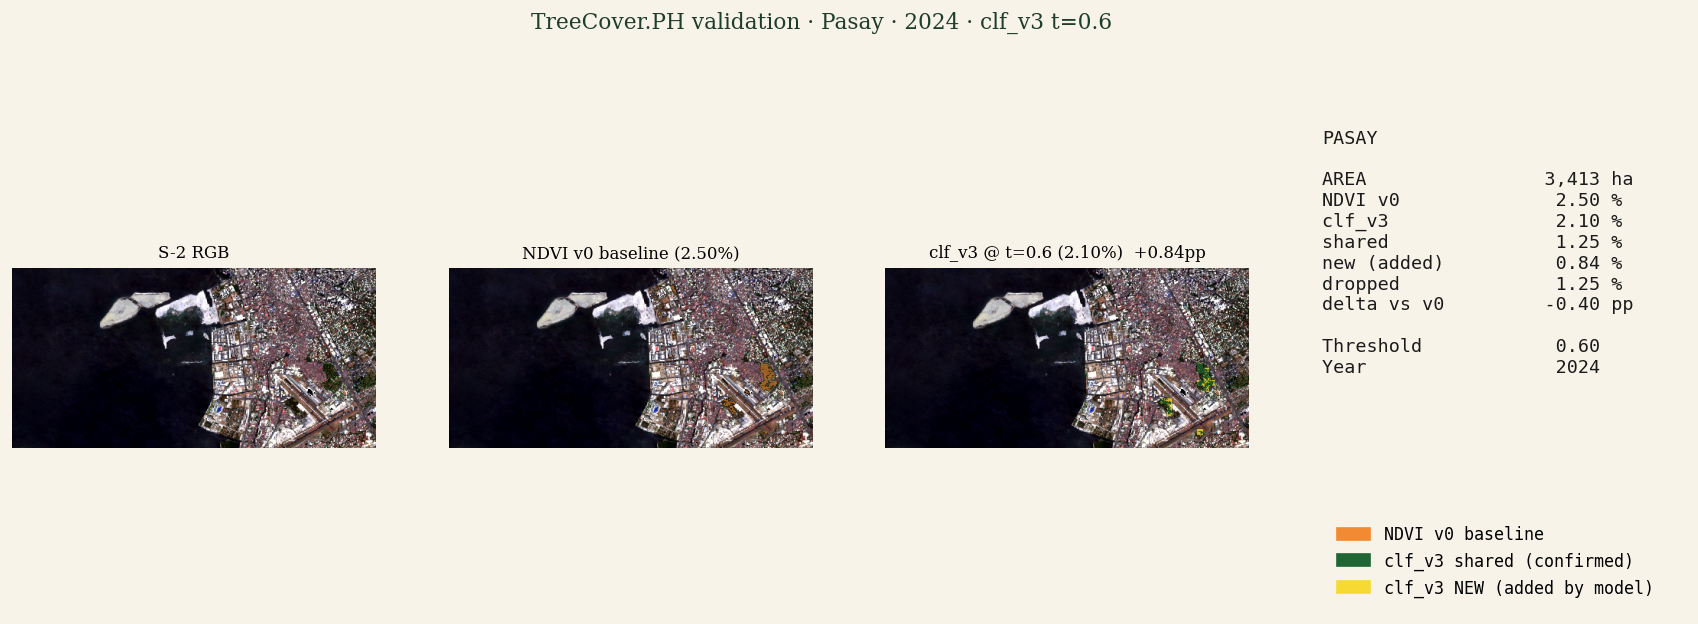
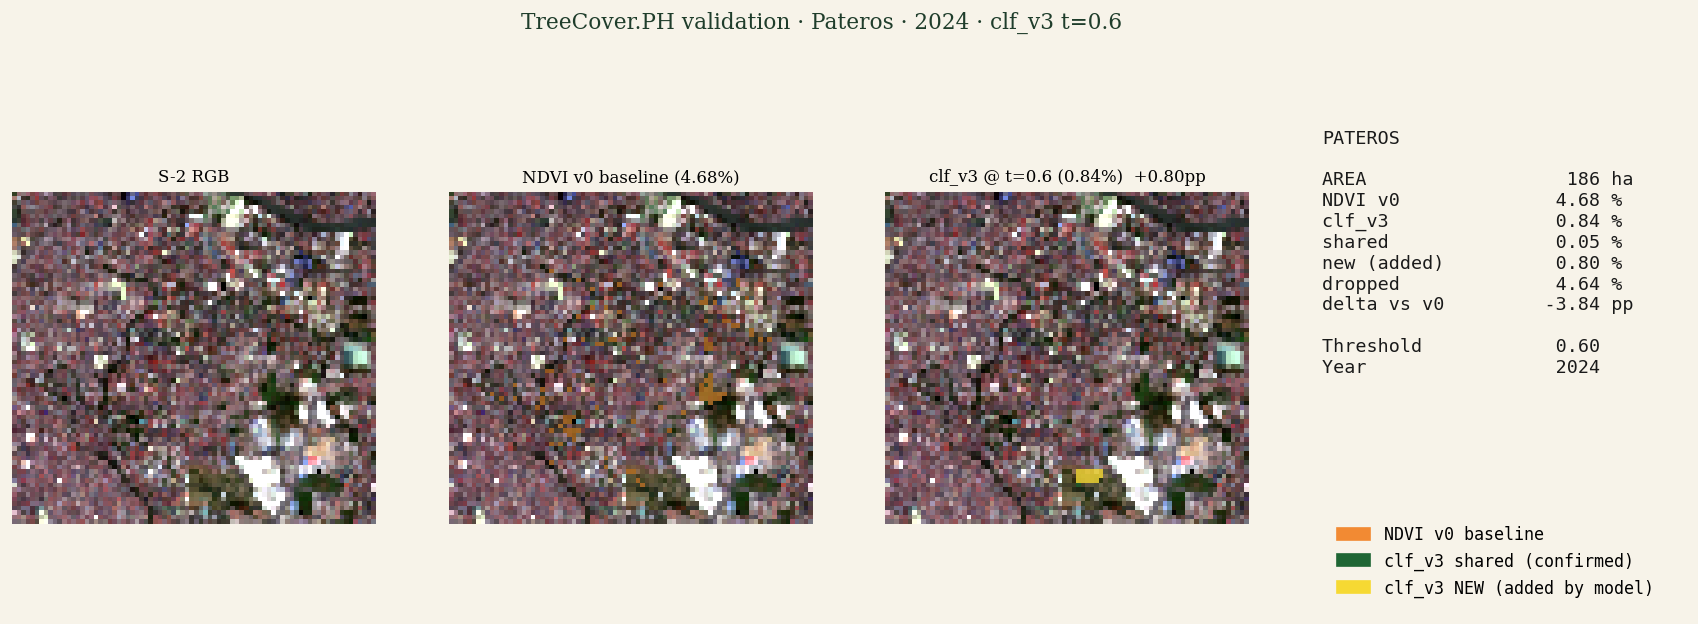
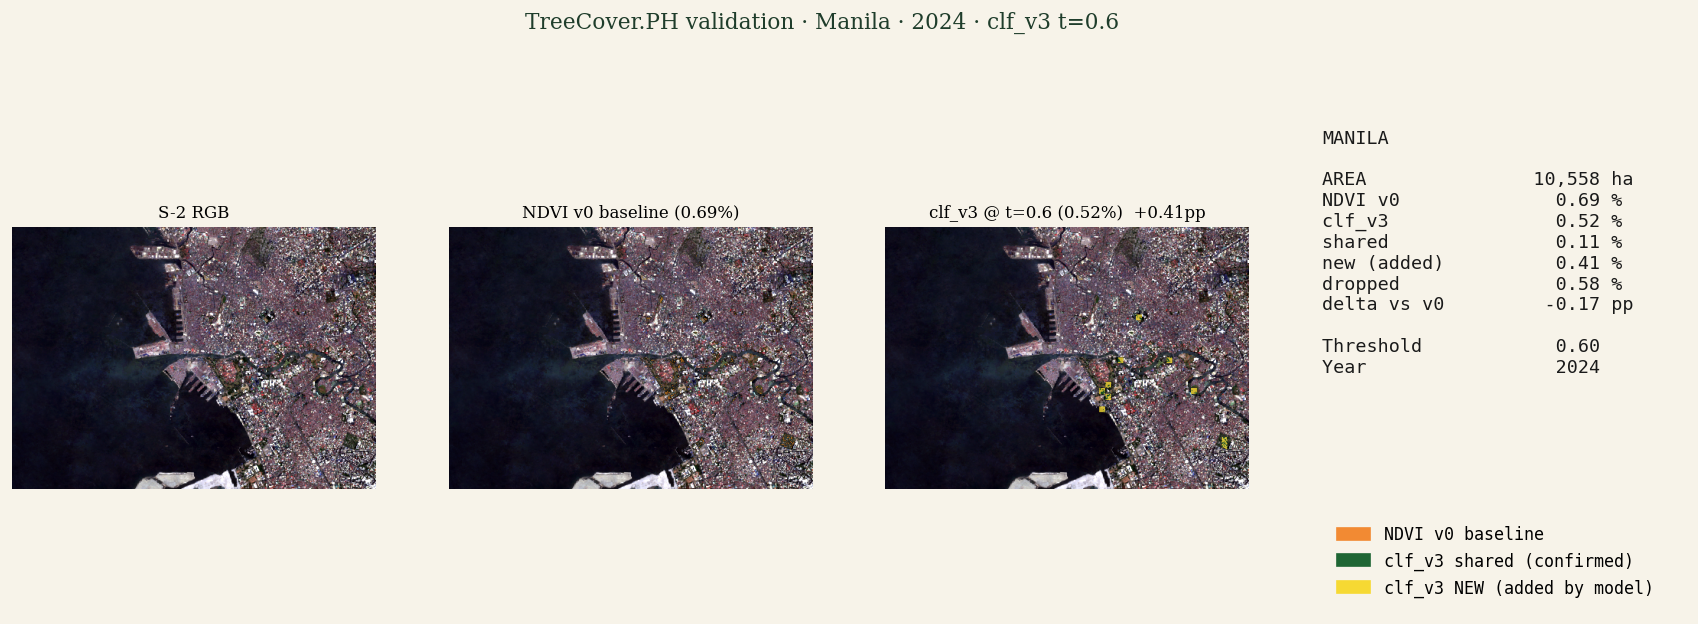
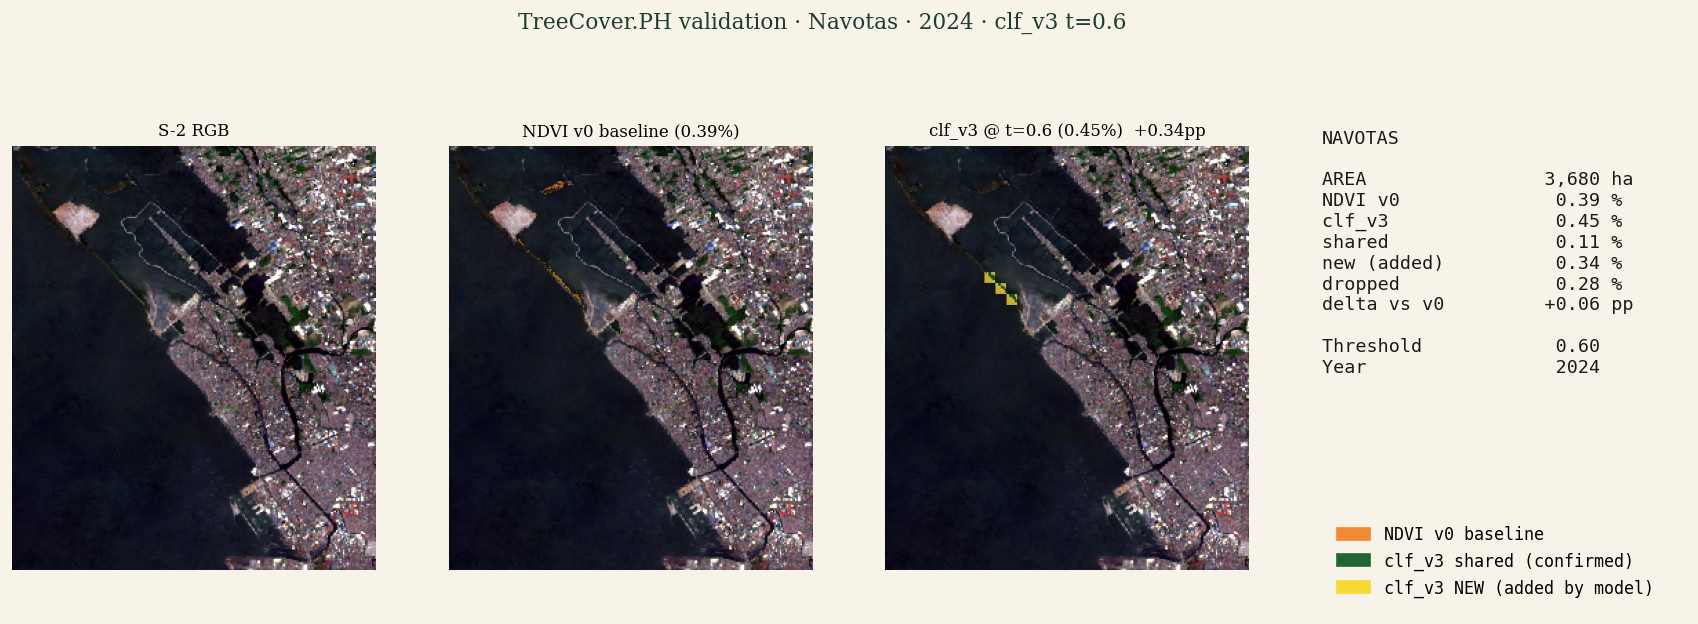
Per-LGU visual validation of the detection model.
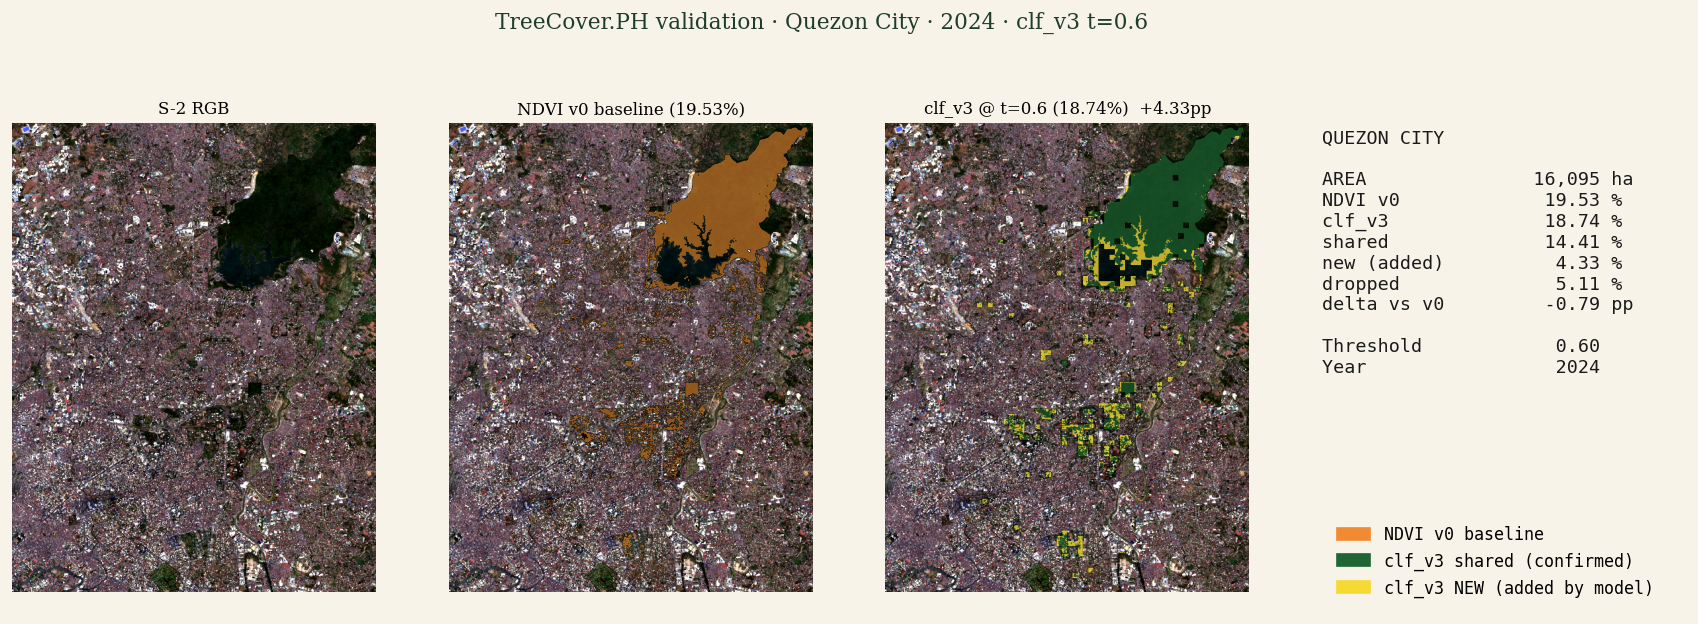
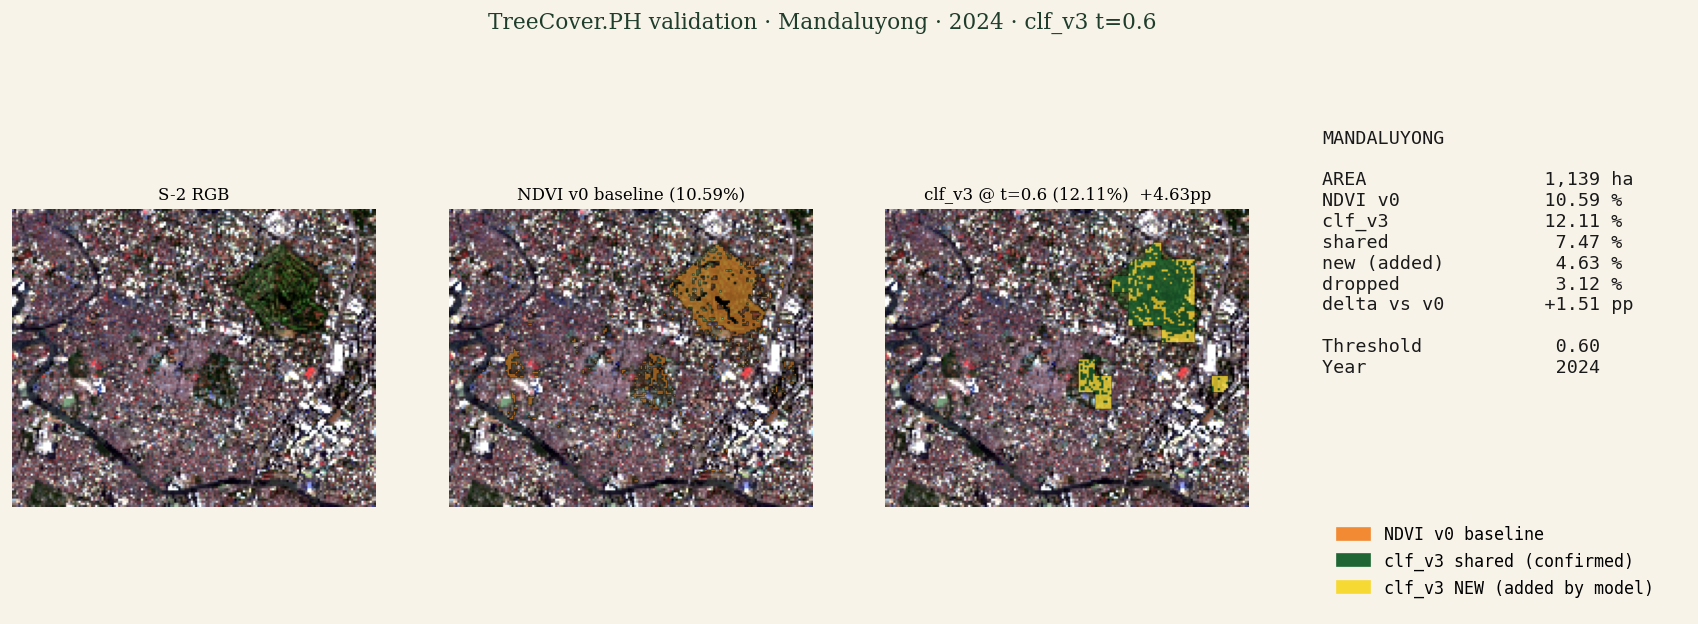
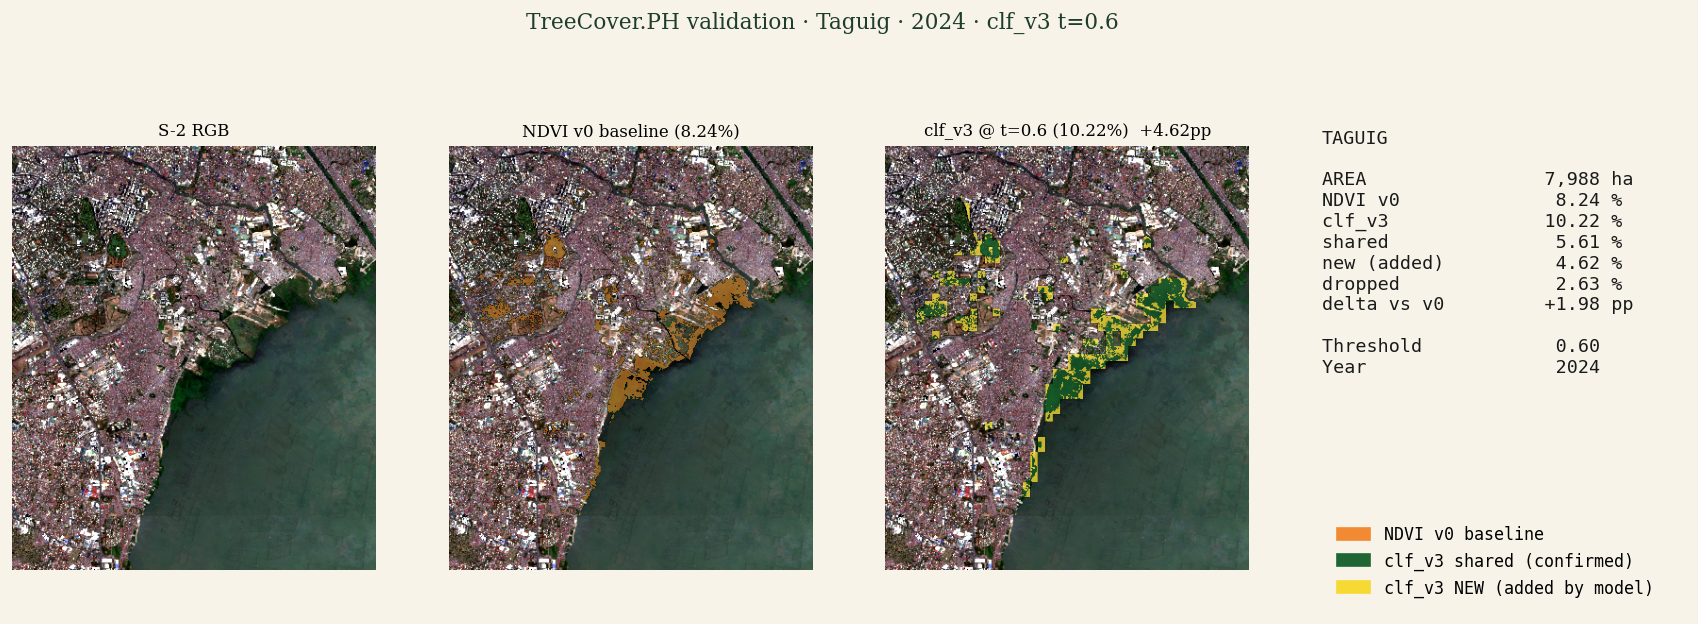
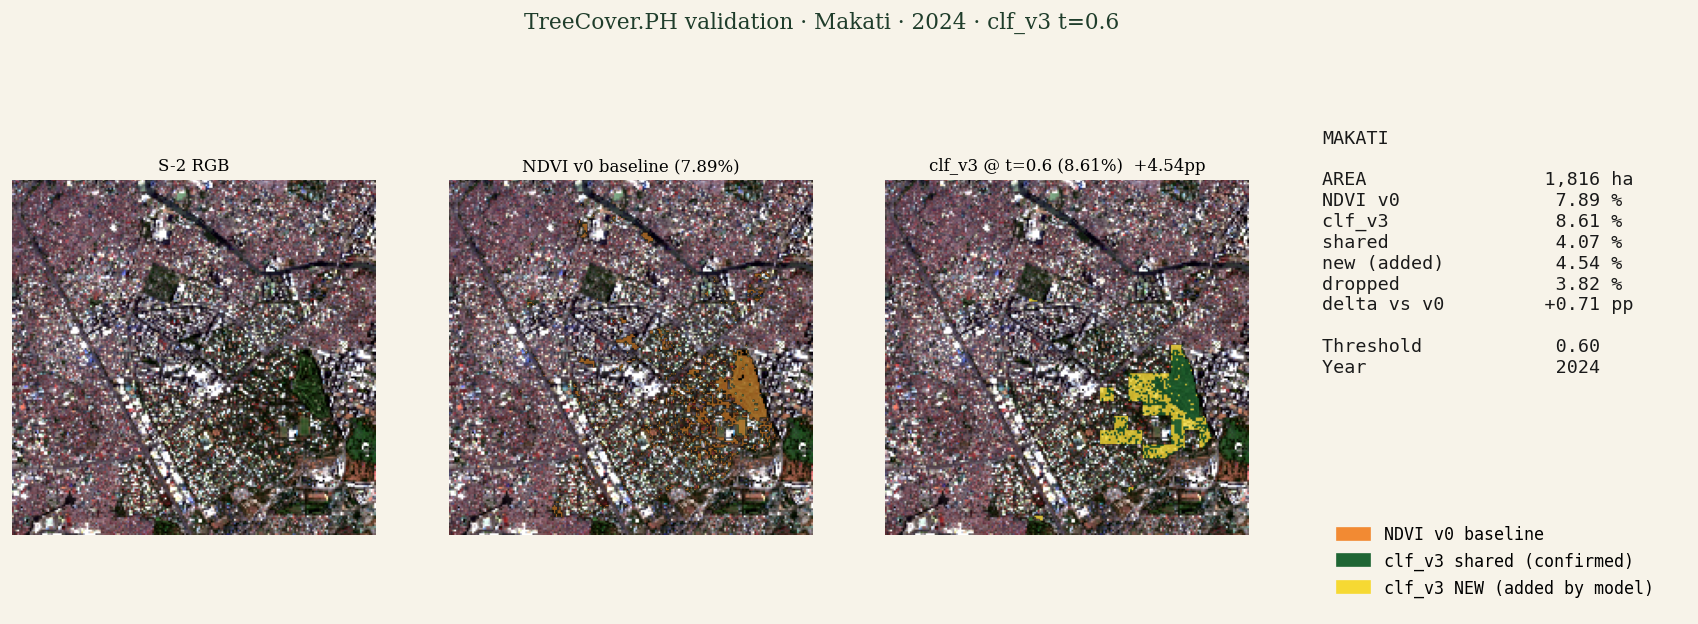
One panel per city. Each lays the model's canopy reading over the satellite
image so you can see, block by block, where it agrees with the simpler NDVI
rule and where the two differ. The table below ranks the 17 LGUs by how much
canopy the model reads.
NDVI v0 baselinemodel-confirmed canopymodel differs from NDVI (a difference, not a verified correction)
Under the hood, the detection model is a CLIP ViT-Large/14 head with a
gradient-boosted regression onto Meta's 1 m canopy fraction; on held-out
locations it reaches R² 0.83 to 0.86 under grouped cross-validation
against Meta's 1 m reference (its calibration target, not independent ground
truth), and is in optimization toward a first release. Panels are sorted by
the model's canopy percentage at threshold t = 0.60.
The scan scripts that build these panels are in the public repository (the per-year probability rasters and threshold sweeps are research-track and regenerable, not committed).
Per-LGU table + full pipeline in /methodology.